Like its sister the SWOT Analysis, the Force Field Analysis is a familiar tool to organise information to extract its insights.
The original model was developed in the 1960s by German psychologist Kurt Lewin to visualise the opposing forces inherent in any issue or situation.
The analysis of these forces – both the driving forces (those promoting change) and the restraining forces (those resisting change) – helps determine an appropriate plan of action.
Lewin’s original model and its methodology can be seen here. (You will need to sign-up for free access.)
It’s strictly a personal preference, but I find the Force Field Analysis more useful than a SWOT Analysis. With a SWOT, you complete the four quadrants, but there’s no analytical step.
In the Force Field Analysis, the columns help define and extract the insights so the analysis is built-in to the tool.
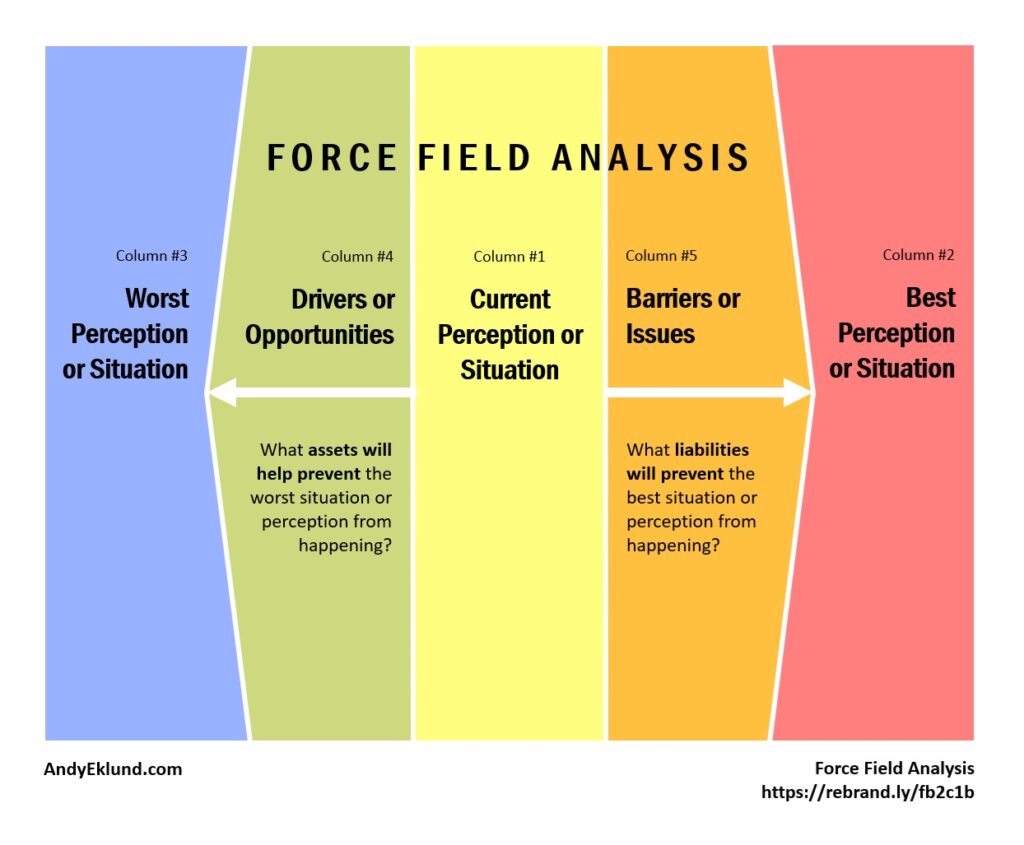
In order, you articulate the Existing Situation, then Best Situation, and finally, the Worst Situation. Next, between the Existing and Best Situations, you identify the most important business barriers or issues to address. Between the Existing and Worst Situations, you identify the key business drivers, opportunities or assets to leverage.
It’s adaptable by switching from a Situation to a Perception, and the tool helps identify communication strategies, if not organisation messages to deliver to key audiences. In this case, it’s an excellent resource to develop a message house, or even an interesting way to start a brainstorm if you’ve completed one in advance. (It takes too long to do one in a brainstorm.)
I use a variation of the Force Field Analysis model from my days at MasterCard. It re-arranges the columns to allow a team to separate and articulate the drivers and opportunities from the barriers and issues.
How the Force Field Analysis Works
First, notice the columns are not sequential from left to right or vice versa.
Start with the central yellow column which describes of outlines the current situation today: good, bad and neutral.
Shift to the far-right red column to outline the best realistic perception or situation.
Move to the far-left blue column to outline the worst realistic perception or situation.
Notice the word realistic. It’s important not to romanticise or exaggerate the best and worst perceptions. Be as objective as possible.
Once the end and middle columns are completed, the real exercise begins.
Compare current situation (yellow) against the worst situation (blue): what drivers or opportunities (green column) will prevent the worst situation from happening, if not help promote change or inspire action?
Compare the current situation (yellow) against the best situation (red): what barriers or issues will prevent the best situation from happening.
The final step is sorting, organising and prioritising both the column of barriers/issues and column of drivers/opportunities to determine or brainstorm the appropriate action to be taken.
Instructions for a Force Field Analysis
Part 1: Add the data to the model.
- Hang five flipchart pages on a wall, or create five columns on a large page of paper in front of you. Use the artwork to check the order of columns.
- Choose one audience or one issue. Or, use a different FFA for each issue or audience. If you’re pressed for time and space, I’ve used different colours for different audiences if you’re only doing one FFA.
- Gather your research. Individually or amongst the team, translate the relevant information and insights to the appropriate chart. Or, if it may be necessary to discuss and debate the information, work together as a team, going column by column. It depends upon how complex you think your analysis needs to be.
- Use bullet points as you add information to each column. It’s easier to analyse each individual point when moving between columns.
- Complete the Current Perception column (#1) by describing the existing environment, either from a market analysis or situation point-of-view, or from the perspective of a single target audience. The statements of fact may be good, neutral or bad perceptions, held by the target audience or believed by a majority of the audiences.
- Complete the Best Perception column (#2). What is the best perception that the target audience might think, feel or believe about the specific topic?
- Complete the Worst Perception column (#3). What is the worst perception that the target audience might think, feel or believe about the specific topic?
- Complete the Drivers/Opportunities column (#4). What “forces” (the drivers, opportunities, assets, or general good news) will prevent the target audience from shifting from the current situation to the worst perception?
- Complete the Barriers/Issues column (#5). What “forces” (the barriers, issues, challenges, liabilities, or problems) will prevent the target audience from shifting from the current situation to the best perception? Phrase each statement as an issue. For example, “Compliance” is a vague statement. “Patients are not compliant” is an issue.
Congratulations, you’re half-way finished.
Part 2: Analyse the data.
Remove any element that is ‘cancelled out’ by any other element.
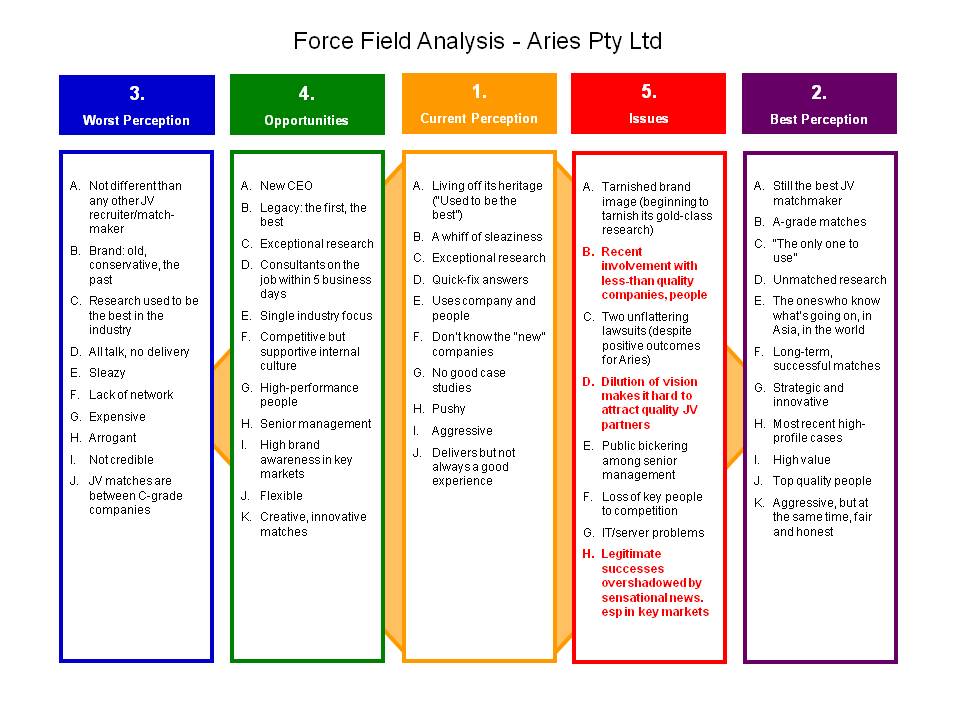
Check if any element in the Drivers/Opportunities column (#4) cancel out any element in the Barriers/Issues column (#5). If so, draw a line through both elements in both columns. In the example, you might choose to cancel out #5F (Loss of Key People) with 4A (New CEO).
Be careful! I prefer never to erase anything. Instead, draw a line through the words so you don’t forget the original thought.
Remove what can’t be changed.
In the Barriers/Issues column (#5), remove any specific element which neither the business nor communications can change by itself. General examples include: “Poor economy” or “Strong competition.” Or, re-word the statement as a true issue. “Strong competition” might become “Our product has no differentiation from competitor’s products. In the example, you might strike out #5C (Two unflattering lawsuits). They are past history, and little can be done about it now.
Flag anything that needs more input, research or consideration.
Note any individual element in the Barriers/Issues column (#5) which the organization needs to address independently or concurrently. In the example, the problem with IT and servers needs to addressed. It’s often helpful to put due dates for each so you can check-up later on.
Prioritise the Drivers/Opportunities elements.
Prioritize elements in the Drivers/Opportunities column (#4). These often turn out to be the core of assets or future key messages. More so, you might (separately) consider or double-check the order.
Also, review whether any individual element in the Drivers/Opportunities column might address or influence an element in the Barriers/Issues column.
Prioritise the Barriers/Issues elements.
Prioritize all elements in the Barriers/Issues column (#5). Flag the top three to five issues or challenges that must be addressed in your campaign. In the example, I’ve highlighted the top three issues that communications needs to address in red bold.
Determine your strategies.
Draft business or communications strategies for each of the three to five issues in the Barriers/Issues column (#5).
Review the FFA as a whole.
- Is there any other element, issue or insight that needs further investigation?
- Are there any assumptions which need to be examined?
- Do you need to share the FFA with others for input, discussion or debate?
- What are the next steps?
At this point, you might use the completed Force Field Analysis to start a brainstorm. What ideas can (help to) address, alleviate or neutralise the three to five issues in column #5? What ideas can leverage any of the opportunities in column #4?
Finally, if doing this as a group exercise, you might consider involving a neutral facilitator to manage the process, help write the group’s comments and opinions, and allow everyone to engage and focus.
Download the Force Field Analysis in Word here.
Any comments or suggestions? Any other tool you’ve used to help organise and decipher information? Please add your thoughts below.


No comment yet, add your voice below!